Summary statistics
Probability density
Summary statistics
Probability density
Without prior information on the prevalence, a uniform beta prior is used: Beta(1, 1)
Summary statistics
Probability density
The posterior density distributions of the MCMC chains should overlap to a high degree.
If the posterior density distributions have converged, the traces of the MCMC chains should mix well giving an impression of 'white noise'.
Running means of all MCMC chains should converge to the same value.
If the shrink factor (a.k.a. potential scale reduction factor) stabilizes below a value of about 1.1 (red dashed line) then convergence has probably occurred.
This web app provides easy-to-use means for Bayesian Prevalence Estimation under Misclassification (in short, BayesPEM). Misclassifications occur when diagnostic tests are imperfect, with test characteristics —sensitivity and/or specificity— smaller than one.
In a Bayesian framework, probabilities are not interpreted as long-term frequencies but rather as quantities that represent a state of knowledge or belief about the true state of the world. In Bayesian inference, prior knowledge needs to be specified first. Then, a likelihood function for the available data is used to update this knowledge according to Bayes' theorem, yielding the posterior knowledge.
In the BayesPEM web app, prior knowledge or belief about the true prevalence as well as the sensitivity and specificity of the diagnostic test is expressed in terms of probability distributions. Prior knowledge may derive from previous studies or expert opinion. Data from the application of the diagnostic test to the test samples are entered, and upon running the model the web app updates the probability distributions which then describe the posterior knowledge about the true prevalence (and the sensitivity/specificity).
However, the posterior probability distribution can not be calculated analytically. Instead, it is numerically approximated by random sampling algorithms referred to as Monte Carlo Markov Chain (MCMC) methods. To ensure that values are sampled from a stationary distribution, so-called convergence diagnostics are evaluated, both automatically by the algorithm as well as through visual inspection of diagnostic plots by the web app user. If convergence of the chains has been achieved, the posterior probability distribution represents the updated knowledge about the true prevalence as well as the sensitivity/specificity. The mean of the distribution provides a point estimate for the true prevalence. The broader the probability distribution, the less certain the knowledge about the true prevalence is. The 95% highest density interval (HDI) denotes the range of prevalence estimates that together account for 95% of the probability mass of the distribution. Any value outside the 95% HDI has less probability than the values inside of it. Therefore, the 95% HDI constitutes a natural measure of uncertainty for the estimate.
|
|
The first version of this web application was developed at the German Federal Institute for Risk Assessment (BfR) as part of the ZooGloW project. |
|
This app runs JAGS (Just Another Gibbs Sampler) in the background and would not be possible without the following R packages: bde, BEST, dplyr , ggmcmc, ggplot2, HDInterval, magrittr, R2jags, plyr, rriskDistributions, runjags, shiny, shinyBS, shinycssloaders, shinydashboard, shinyjs, shinythemes, stringr, tidyr, xtable
The code for this app is currently hosted inhouse but will be made publicly available in the future.
You may contact the developers by email:
shiny at bfr.bund.de
Flor, M., Weiß, M., Selhorst, T., Müller-Graf, C., Greiner, M. Comparison of Bayesian and frequentist methods for prevalence estimation under misclassification. BMC Public Health 20, 1135 (2020). https://doi.org/10.1186/s12889-020-09177-4
Bundesinstitut für Risikobewertung (BfR)
Anstalt des öffentlichen Rechts
Max-Dohrn-Straße 8-10
10589 Berlin
Telefon: +49 30 18412 0
Telefax: +49 30 18412 4970
E-Mail: bfr@bfr.bund.de
Website: www.bfr.bund.de
Gesetzlich vertreten durch den Präsidenten Prof. Dr. Dr. Andreas Hensel
Aufsichtsbehörde: Bundeministerium für Ernährung und Landwirtschaft (BMEL)
Ust.-IdNr. des BfR: DE 165893448
Die Inhalte auf dieser Webseite dienen ausschließlich informatorischen Zwecken. Wir bemühen uns, die Inhalte möglichst aktuell zu halten. Mit der Bereitstellung der Inhalte ist aber keine Gewährleistung und keine Garantie für Richtigkeit und Vollständigkeit verbunden. Jede Nutzerin und jeder Nutzer der Inhalte ist selbst dafür verantwortlich, sich über die für sie und ggf. ihren Betrieb / ihr Unternehmen geltenden rechtlichen Bestimmungen zu informieren und diese einzuhalten. Das BfR nimmt keine diesbezügliche Prüfung vor. Es ist nicht gewährleistet, dass durch die Nutzung der Inhalte dieser Webseite die geltenden rechtlichen Regelungen eingehalten werden. Unbeschadet des Vorstehenden haftet das BfR nicht für Schäden aus der Nutzung der Inhalte dieser Webseite. Für Schäden aus der Verletzung des Lebens, des Körpers und der Gesundheit sowie für sonstige Schäden, die aus einer vorsätzlichen oder grob fahrlässigen Pflichtverletzung des BfR, eines gesetzlichen Vertreters oder Erfüllungsgehilfen beruhen, gelten abweichend von dem vorstehenden Satz ausschließlich die gesetzlichen Bestimmungen.
Sämtliche Inhalte dieser Webseite sind geistiges Eigentum des BfR. Nutzerinnen und Nutzer dürfen die Inhalte für persönliche oder amtliche, nicht kommerzielle Zwecke anwenden. Weitergehende Nutzungsrechte, insbesondere hinsichtlich der Weitergabe, Vervielfältigung, Veränderung und einem Download bedürfen der ausdrücklichen vorherigen schriftlichen Erlaubnis des BfR. Für kommerzielle Zwecke dürfen die Inhalte dieser Webseite in keinem Fall verwendet werden.
Prior predictive checks
Prior predictive checks are solely based on repeated sampling from prior distributions and do not involve any JAGS model runs. Data are only used in so far as they are compared to what would be expected from the priors. You may think of these checks as a form of hypothesis test: 'Based on our priors, what is the probability of collecting the observed data or more extreme data?' If the probability falls outside a 95% credible interval then the predictive check issues a warning. I.e., a warning means that your prior beliefs do not fit well with the data, so you may check back on your beliefs. Nevertheless, you can still run the model despite of the warning.
Two plots are generated to inspect prior predictive distributions: A ribbon plot and a density plot . In addition, the Rogan-Gladen point estimate for the prevalence is calculated using the means of the prior distributions.
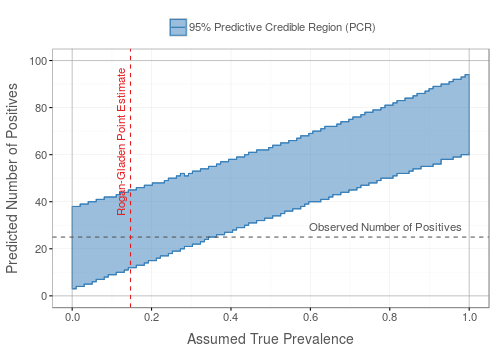
Ribbon plots
For ribbon plots, only sensitivity and specificity priors are used, whereas for the prevalence a fixed true value is assumed. From the resulting sampling distribution of positive data samples, the 95% credible interval is retrieved, and this process is repeated for different assumed true prevalence values such that a ribbon-shaped 95% predictive credible region is formed.
Good
Both the lines for the observed number of positives and the Rogan-Gladen estimate intersect with the ribbon.
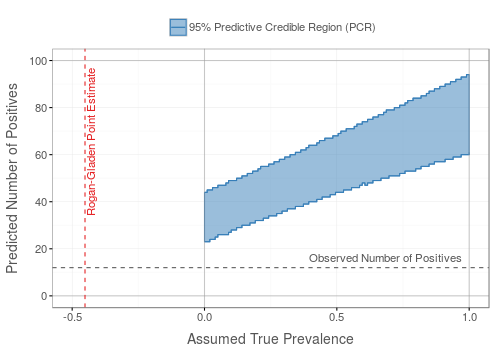
Bad
Neither the line for the observed number of positives nor for the Rogan-Gladen estimate intersect with the ribbon. Note that these two checks do not always coincide.
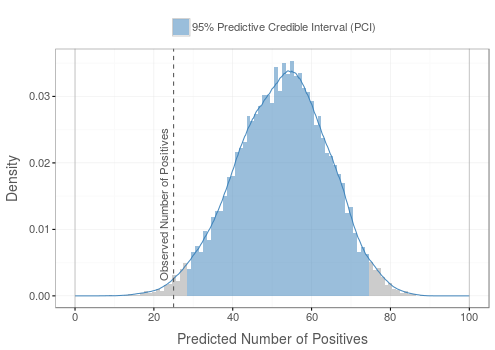
Density plots
For density plots, sensitivity, specificity, and prevalence prior are taken into account. The resulting sampling distribution of positive data samples is plotted as a histogram. The 95% predictive credible interval is shaded in green.
Good
The line marking the observed number of positives lies within the 95% interval.

Bad
The line marking the observed number of positives lies outside the 95% interval.
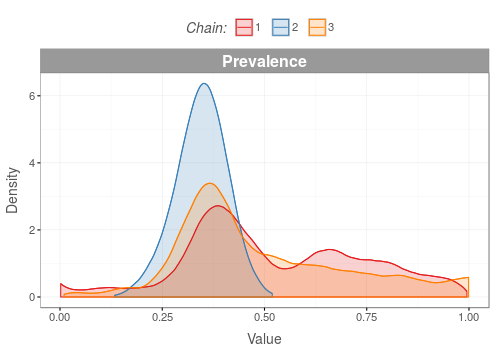
MCMC Convergence Diagnostics: Density Distributions
For all monitored variables, the probability density of each Monte-Carlo Markov Chain (MCMC) is plotted. Each of the chains has its own color. They should overlap to a high degree. Large differences between the densities of the chains suggest convergence problems.
Good
If chains have converged to the same stationary distribution then the plots of their densities overlap to a high degree.

Bad
For chains that have failed to converge, plots of their densities overlap to a lesser degree.
MCMC Convergence Diagnostics: Traceplots
If the posterior density distributions have converged, the traces of the MCMC chains should mix well giving an impression of 'white noise'.
Good
The traces of the MCMC chains give an impression of 'white noise'.
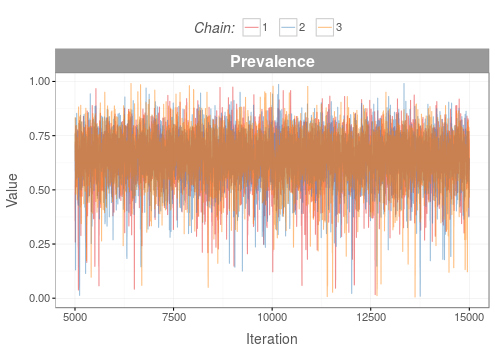
Bad
The traces of the MCMC chains do not give an impression of 'white noise'.

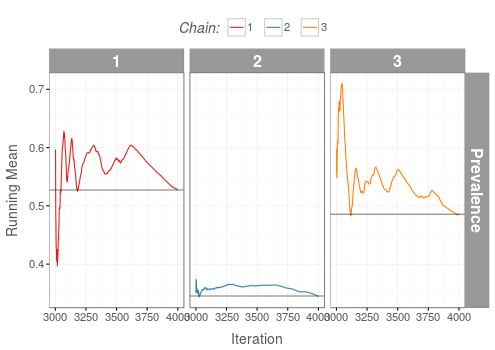
MCMC Convergence Diagnostics: Running Means
Running means of all MCMC chains should converge to the same value.
Good
Running means of all MCMC chains have converged to the same value.
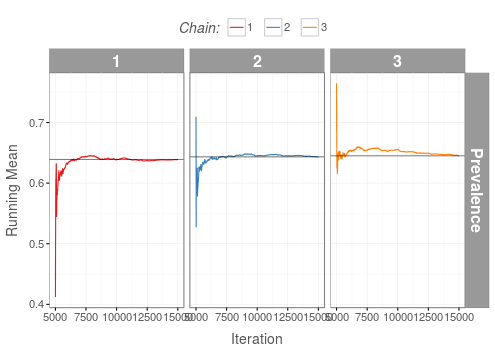
Bad
Running means of all MCMC chains have converged to different values.
MCMC Convergence Diagnostics: Shrink factors
If the shrink factor (a.k.a. potential scale reduction factor) stabilizes below a value of about 1.1 (red dashed line) then convergence has probably occurred.
Good
The shrink factor has stabilized below the red dashed line.

Bad
The shrink factor has not stabilized below the red dashed line.
